Fun with Community Notes data
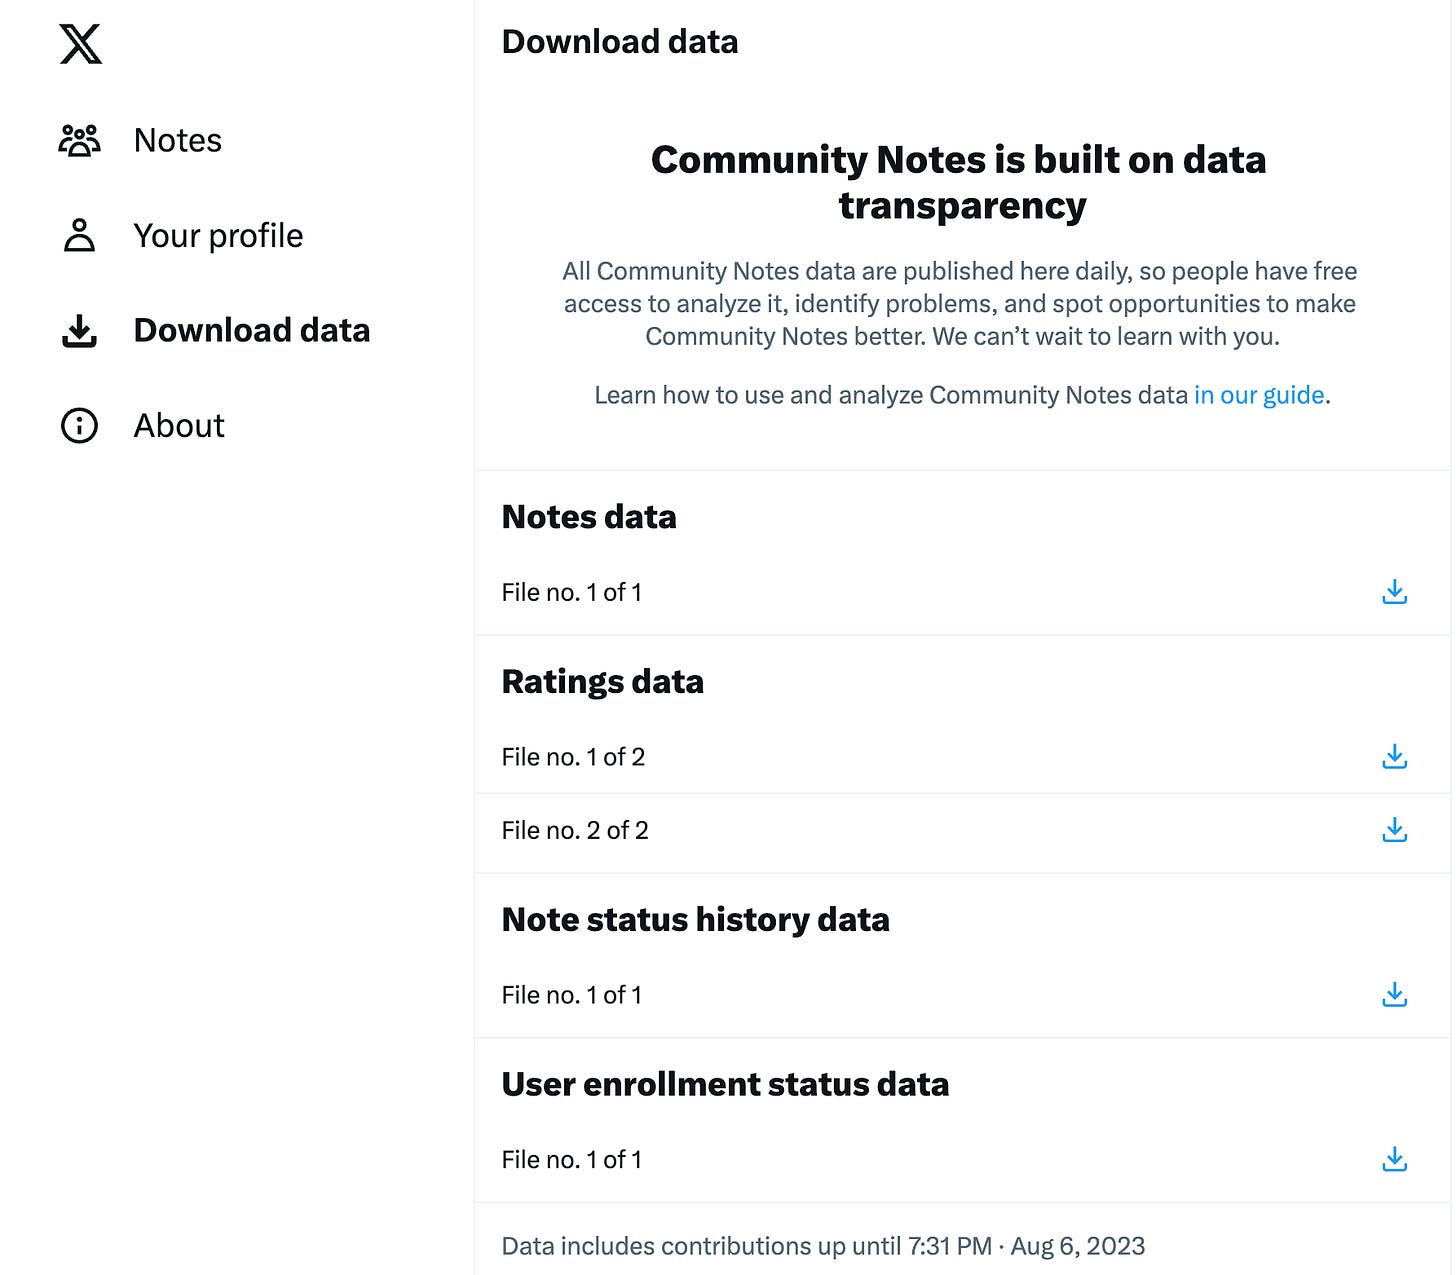
At least for now, X/Twitter still makes the full set of Community Notes and ratings available for download and analysis
Among the features of X/Twitter’s crowdsourced fact-checking system, Community Notes (formerly known as Birdwatch), is the ability to download and study the underlying data. Four types of data are available: the full set of notes (both displayed and otherwise), the ratings these notes have received from users, the current and historical status of each note, and an anonymized list of participating users. (An important caveat to the anonymity of Community Notes authors: it is possible to determine which notes were written by the same author, which in some cases may render the author identifiable.) This article focuses on two of those datasets, specifically the note and status data.
Community Notes data is stored in .TSV (tab-separated values) files, which are plain text files that can be read by a variety of programming language libraries as well as most spreadsheet software. The examples in this article are in Python, but equivalent code can be conjured up in pretty much any programming language.
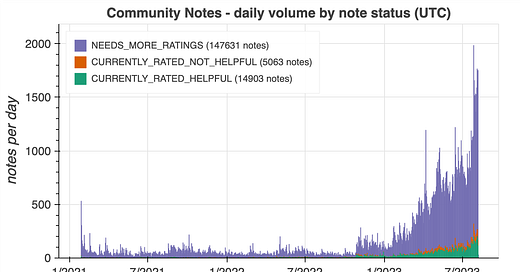
First, let’s load the note and status files into data frames and plot a basic bar chart showing the daily volume of notes colored by the current note status (helpful, not helpful, or needs more ratings).
import bokeh.plotting as bk
import bokeh.palettes as pal
import bs4
import pandas as pd
import requests
import time

# load the notes and their current status
notes = pd.read_csv ("notes-00000.tsv", sep="\t")
notes["t"] = pd.to_datetime (notes["createdAtMillis"], unit="ms")
print ("total notes: " + str (len (notes.index)))
history = pd.read_csv ("noteStatusHistory-00000.tsv", sep="\t")
df = notes.merge (history, on="noteId")
print ("notes with status values: " + str (len (df.index)))

# print a summary table of current note statuses
g = df.groupby ("currentStatus")
summary = pd.DataFrame ({"count" : g.size ()}).reset_index ()
print (summary)

# aggregate by date and status
df["date"] = df["t"].dt.date
g = df.groupby (["date", "currentStatus"])
days = pd.DataFrame ({"count" : g.size ()}).reset_index ()
days = days.sort_values (["date", "currentStatus"])
days["y2"] = days.groupby("date")["count"].cumsum ()
days["y1"] = days["y2"] - days["count"]
summary["color"] = pal.Dark2[len (summary.index)]

# build the graph
p = bk.figure (width=720, height=420, x_axis_type="datetime",
        y_range=(0, days["y2"].max () * 1.1),
        x_axis_label="date", y_axis_label="notes per day",
        title="Community Notes - daily volume by note status (UTC)")
for i, r in summary.sort_values ("currentStatus",
                                 ascending=False).iterrows ():
    status = r["currentStatus"]
    data = days[days["currentStatus"] == status]
    desc = status + " (" + str (r["count"]) + " notes)"
    p.quad (bottom=data["y1"], top=data["y2"], left=data["date"],
            right=data["date"] + pd.Timedelta (days=1),
            color=r["color"], line_width=0.5, legend_label=desc)
p.legend.location = "top_left"

# adjust font sizes and show graph
p.xaxis.axis_label_text_font_size = "15pt"
p.yaxis.axis_label_text_font_size = "15pt"
p.yaxis.major_label_text_font_size = "12pt"
p.xaxis.major_label_text_font_size = "12pt"
p.title.text_font_size = "14pt"
p.title.align = "center"
bk.show (p)As of August 8th, 2023, the Community Notes dataset contains a total of 167597 notes, 14903 of which (8.9%) are currently rated helpful and are visible on posts. An additional 5063 notes (3.0%) have been rated not helpful, and the remaining 147631 notes (88.1%) are in limbo due to having received an insufficient number of ratings. The volume of notes being written has been steadily increasing since late 2022, roughly corresponding to when the Community Notes system was rolled out worldwide.
The remainder of this article focuses on notes that have been rated helpful and are thus displayed on posts. In some cases, more than one note on a given post is rated helpful and the note shown to a given user is randomly selected from the notes that have achieved helpful status. As of the time of this writing, 13176 posts on X/Twitter have visible Community Notes.
# limit to notes currently shown on posts
shown = df[df["currentStatus"] == "CURRENTLY_RATED_HELPFUL"]
print ("visible notes: " + str (len (shown.index)))
print ("posts with notes: " + str (len (set (shown["tweetId"]))))

# count the number of notes on each post
g = shown.groupby ("tweetId")
posts = pd.DataFrame ({"count" : g.size ()}).reset_index ()
posts = posts.sort_values ("count", ascending=False)
data = posts[posts["count"] > 1]
Although the Community Notes dataset includes the unique ID of the post each note is attached to, the content of the post and the handle of the account that posted it are absent. Until recently, it would have been trivial to obtain this data via the free Twitter API, but the removal of this data source necessitates the use of more unconventional methods. Since the current X/Twitter management is rumored to be sensitive about automated scraping of public content from their platform, we’ll avoid doing so. Instead, we can take advantage of the fact that X/Twitter content is widely indexed by search engines and use DuckDuckGo search results to tie the unique post IDs of the posts with multiple visible notes to the handles of the X/Twitter accounts that posted them.
# filter to posts with at least two visible notes
# use duckduckgo to map the IDs to handles
agent = "Mozilla/5.0 (Windows NT 10.0; Win64; x64) AppleWebKit/537.36" \
        + "(KHTML, like Gecko) Chrome/115.0.0.0 Safari/537.36"
handles = []
errors = []
for tweet_id in data["tweetId"]:
    id_str = str (tweet_id)
    url = "https://html.duckduckgo.com/html/?q=" + id_str
    items = set ()
    attempt = 1
    handle = None
    while handle is None and attempt < 4:
        time.sleep (1 + 3 * attempt)
        r = requests.get (url, headers={"User-Agent" : agent})
        soup = bs4.BeautifulSoup (r.text, "html.parser")
        elements = soup.find_all ("a", {"class" : "result__url"})
        if len (elements) > 0:
            text = elements[0].text.strip ()
            if "/status/" in text and text.endswith (id_str):
                handle = text.split ("/")[1]
                if len (handle) == 1 or "." in handle:
                    attempt = 4
                    handle = ""
        attempt = attempt + 1
    if handle is None:
        handle = ""
    print (id_str + " " + handle)
    handles.append (handle)
    if handle == "":
        errors.append (tweet_id)
data["handle"] = handles
data.to_csv ("noted_posts.csv")
pd.DataFrame ({"id" : errors}).to_csv ("noted_posts_errors.csv",
        index=False)
This method is not perfect, as the code above only works when the first DuckDuckGo result for a given post ID is a link to the post itself. It successfully returned the handles of the accounts that posted 1280 of the 1461 posts with multiple Community Notes. The accounts that posted the remaining 181 posts were identified either by viewing the post manually on X/Twitter, or (in cases where the post was deleted or the account suspended) by use of other search engines such as Google and Bing or exploration of Wayback Machine archives.
# fill in the missing entries in noted_posts.csv using the results of
# manual searches before proceeding

# find the accounts with multiple posts with multiple
# Community Notes currently visible
data = pd.read_csv ("noted_posts.csv")
data["handle"] = data["handle"].str.lower ()
g = data.groupby ("handle")
totals = pd.DataFrame ({"count" : g.size ()}).reset_index ()
totals = totals.sort_values ("count", ascending=False)
totals = totals[totals["count"] >= 2]
print (totals[["handle", "count"]])
totals.to_csv ("repeat_noted_accounts.csv", index=False)

# find the accounts with at least 5 posts with multiple
# Community Notes currently visible
totals = totals[totals["count"] >= 5]
print (totals[["handle", "count"]])
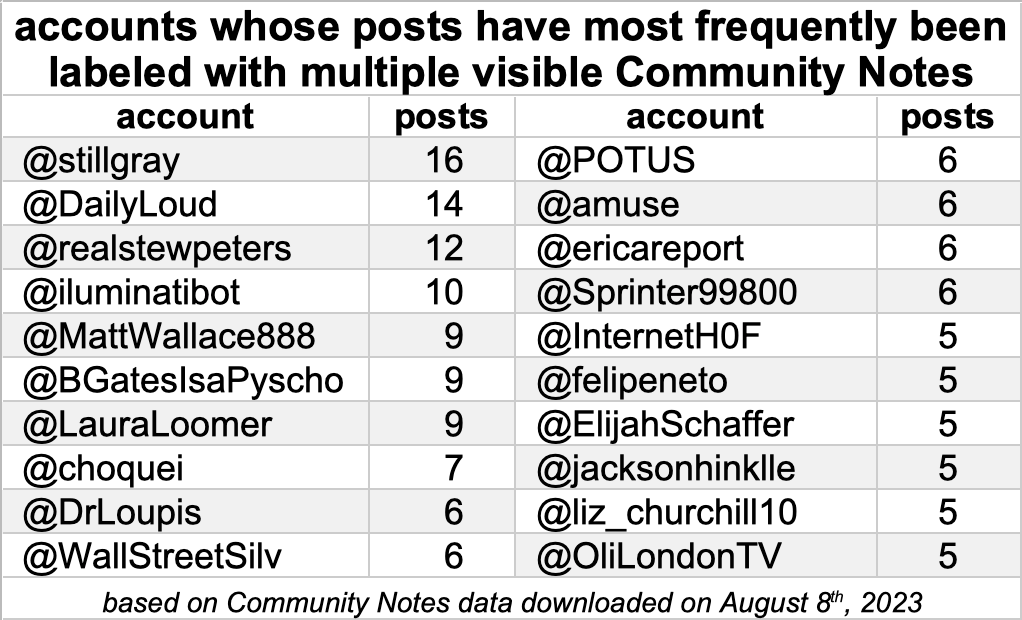
totals.to_csv ("top_noted_accounts.csv", index=False)The table above shows the 20 accounts who have most frequently had their posts labeled with multiple Community Notes. Leading the pack with 16 posts with multiple visible notes is @stillgray (a right wing social media influencer from Malaysia named Ian Miles Cheong) and several other right wing users are frequent fliers as well, including former bounty hunter Stew Peters, failed Congressional candidate Laura Loomer, and podcaster Elijah Schaffer. The most frequently labeled left-leaning accounts are the official @POTUS account and the suspended (and likely inauthentic) clickbait influencer @EricaReport, each with 6 posts with multiple Community Notes as of August 8th, 2023.
Right wing accounts appear to outnumber left wing accounts among the most frequently Community Noted (is that a valid verb?) accounts. Does this pattern hold up if we look at a larger population of accounts whose posts have been labeled with Community Notes? To test this, the accounts first need to be categorized politically. For this analysis, classification was done manually, with English-language accounts with significant political content categorized as “left” or “right”, and non-English and apolitical accounts categorized as “other”. In order to limit the number of accounts to review, only accounts with at least two posts with at least two visible Community Notes were included, for a total of 192 accounts.
# after manually categorizing accounts as left/right/other, plot a
# pie chart; labels in example pie chart were added manually
colors = {
    "right" : "rgb(192,0,0)",
    "left"  : "rgb(0,111,222)",
    "other" : "rgb(160,160,160)"
}

data = pd.read_csv ("repeat_noted_accounts.csv")
g = data.groupby ("category")
data = pd.DataFrame ({"count" : g.size ()}).reset_index ()
cats = ["right", "left", "other"]
data = pd.DataFrame ({"category" : cats}).merge (data)
data["start"] = data["count"].cumsum ().shift ().fillna (0)
total = data["count"].sum ()
ratio = 360 / total
data["startAngle"] = data["start"] * ratio
data["endAngle"] = (data["start"] + data["count"]) * ratio
data["color"] = data["category"].apply (lambda cat: colors[cat])
p = bk.figure (plot_width=750, plot_height=750,
               x_range=[-1.1, 1.1], y_range=[-1.1, 1.1])
p.annular_wedge (x=0, y=0, inner_radius=0, outer_radius=1,
                 start_angle=data["startAngle"],
                 end_angle=data["endAngle"],
                 start_angle_units="deg",
                 end_angle_units="deg",
                 fill_color=data["color"], alpha=0.8)
p.xgrid.grid_line_color = None
p.ygrid.grid_line_color = None
p.xaxis.visible = False
p.yaxis.visible = False
bk.show (p)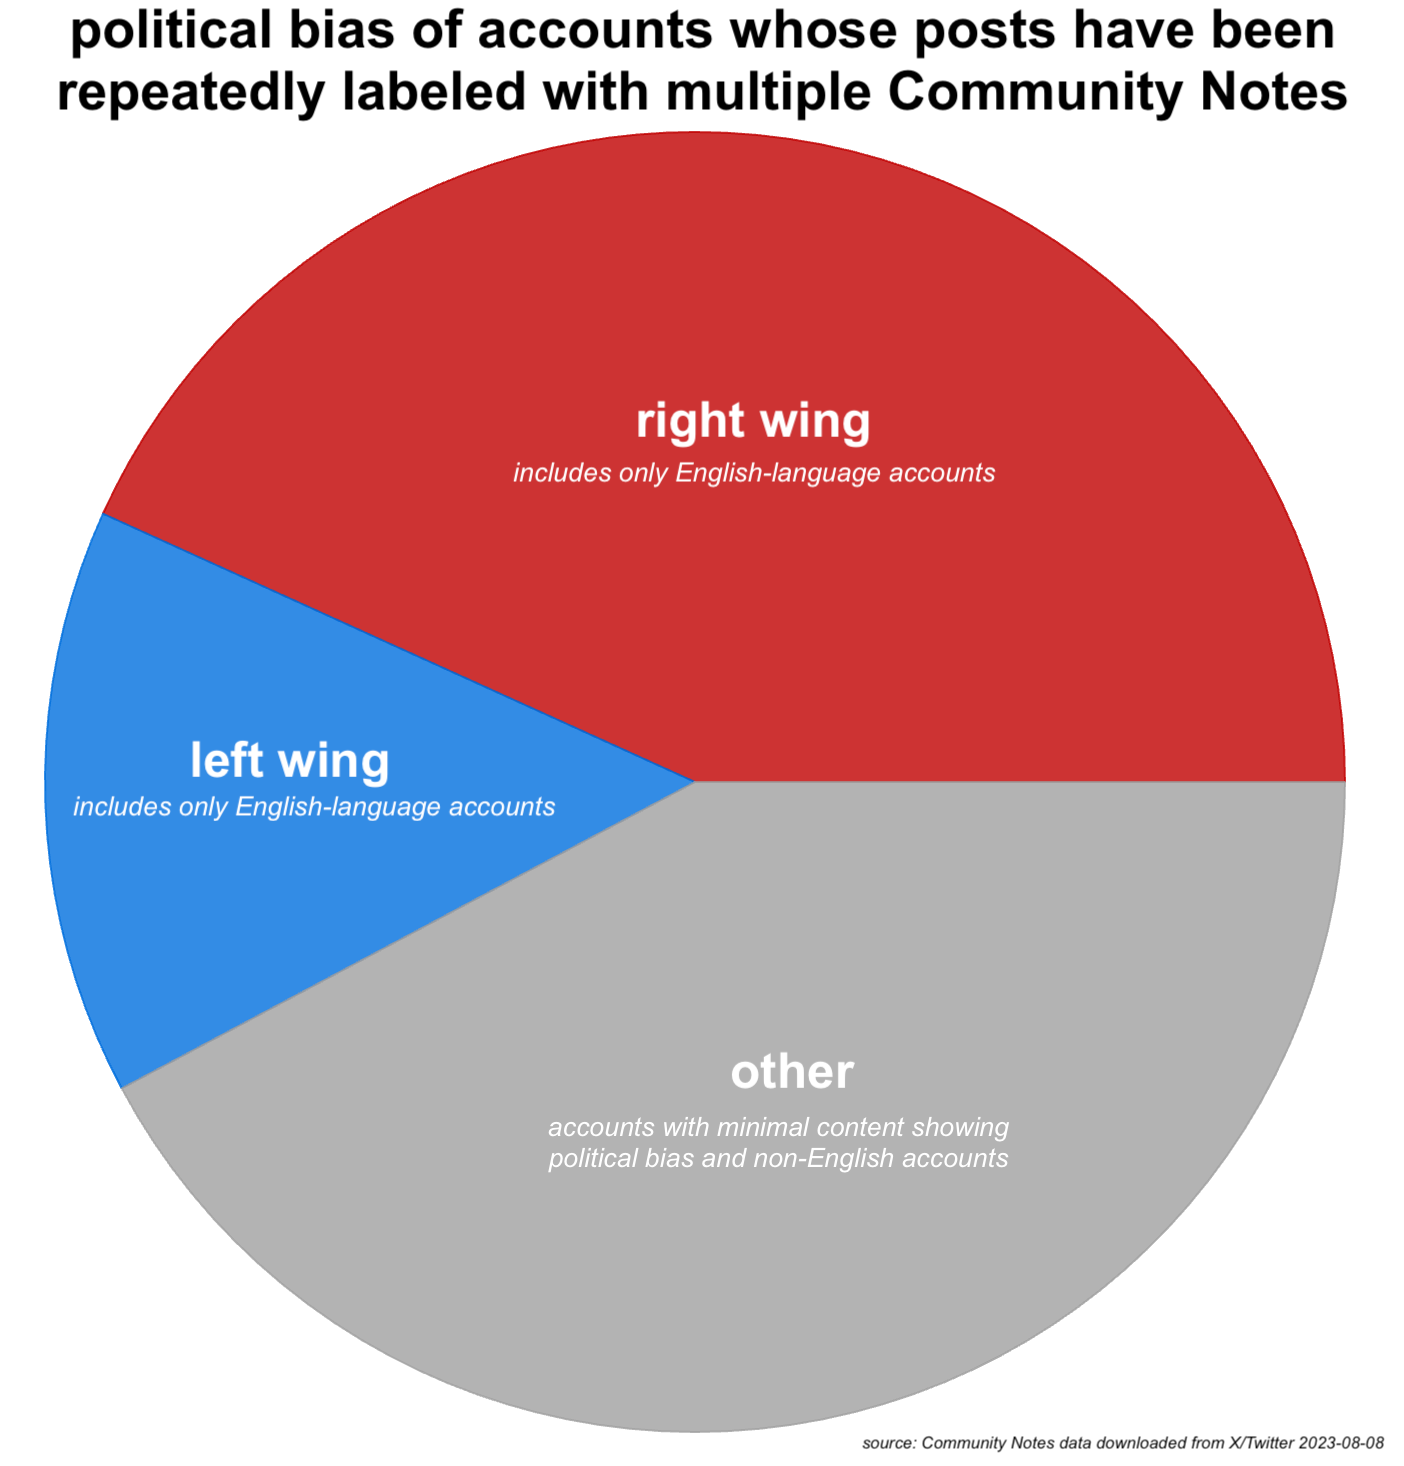
The 192 accounts with multiple posts labeled with multiple Community Notes include almost three times as many English-language right wing accounts (83) as English-language left-wing accounts (28). This suggests that persistent rumors that the Community Notes system is primarily being utilized by conservative Elon Musk fans to label liberal posts are incorrect, as substantially more content from conservative accounts is being labeled with visible notes. (The 81 accounts categorized as “other” are either apolitical accounts such as news feeds and photo aggregators or accounts that primarily post in a language other than English. )
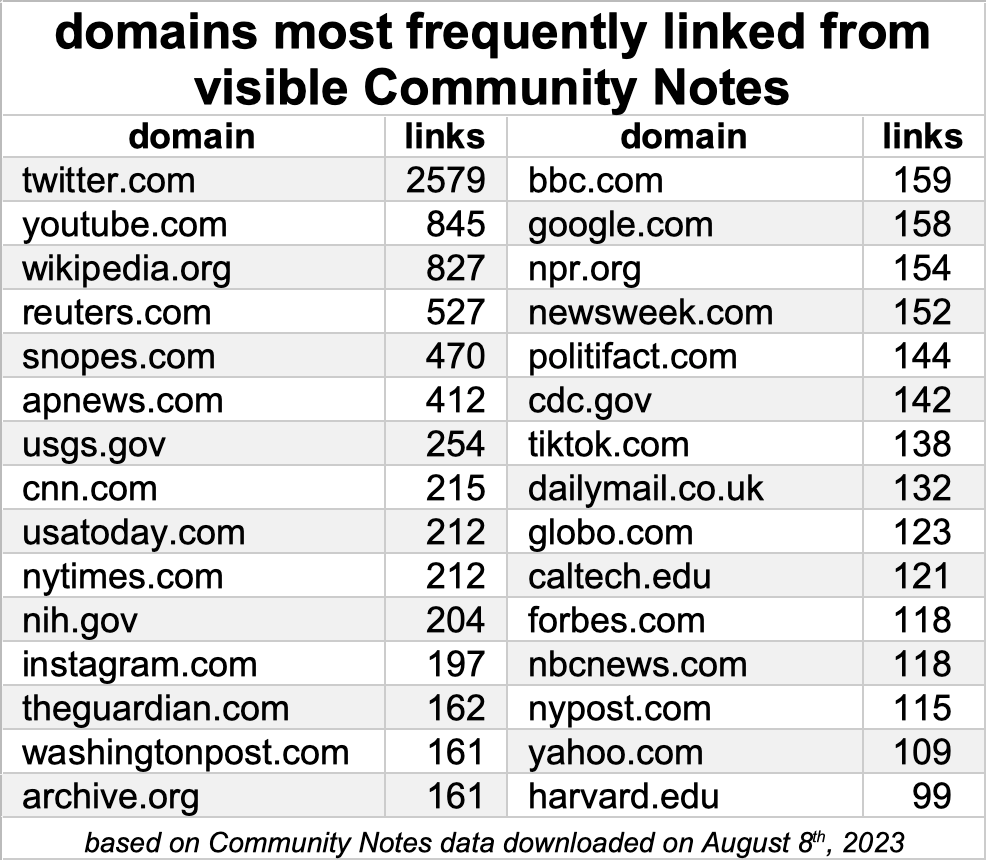
Moving on to another topic, one of the features of Community Notes is the ability to include links to external sources such as news articles or scientific studies that support the note. These links are present in the downloadable Community Notes data, and we can use them to figure out what sources are most frequently linked in notes that have been rated helpful.
# rough attempt to parse top-level domains from all visible notes
shown = pd.read_csv ("visible_notes.csv")
domains = []
for text in shown["summary"]:
    for token in text.split ():
        if token.startswith ("https://") or \
                    token.startswith ("http://"):
            token = token[token.find ("//") + 2:]
            if "/" in token:
                token = token[:token.find ("/")]
            if "?" in token:
                token = token[:token.find ("?")]
            words = token.split (".")
            if len (words) > 2 and len (words[-1]) == 2 \
                    and len (words[-2]) < 4:
                words = words[-3:]
            else:
                words = words[-2:]
            domain = ".".join (words)
            if domain == "youtu.be":
                domain = "youtube.com"
            domains.append (domain)
domains = pd.DataFrame ({"domain" : domains})

# total them up and find the top 30
g = domains.groupby ("domain")
totals = pd.DataFrame ({"count" : g.size ()}).reset_index ()
totals = totals.sort_values ("count", ascending=False)
print (totals.head (30))As it turns out, the website most often cited in Community Notes fact checks on X/Twitter is X/Twitter itself. The second and third most frequent sources are also user-generated content sites, namely YouTube and Wikipedia. The remainder are mostly major Western media organizations such as Reuters, AP, CNN, and the New York Times, with occasional government and academic sites thrown into the mix.
This article is intended as a basic introduction to working with Community Notes data; there are several types of information in the downloadable datasets that aren’t covered here and a nearly unlimited variety of analyses that could hypothetically be performed. I will take this opportunity to once again encourage X/Twitter to reverse their decision to shut down API access for researchers, as the Community Notes data is more useful in combination with public user/post data, and public faith in the Community Notes project is dependent on a high degree of transparency.

